A year of blogging analyzed with R
Today it's exactly one year ago that I published my first blogpost on branchandbound.net. During this year I've written 12 posts, including this one. Since we live in the age of analytics, I thought it would be nice to show how this blog has fared during its first year.
Like most people I use Google Analytics to track what's happening on this site. However, I'm not going to show you screenshots of the GA Dashboard. Not that it's bad (it's actually pretty good), but where's the fun in that? Since this is a programming blog we're going to hook into the Google Analytics API. And this time, without using my standard tools of trade. Instead of using a JVM based language, I'm turning to R to do some number crunching.
Learning R
The R language is geared towards statistical programming and data analysis. Someone described it to me as a headless version of Excel on steroids. I think this gives the right feeling for what R is. If you're coming from a statically-typed background or expect a perfectly crafted language, you're in for a culture shock. R lives firmly in the camp of 'shut up, it works' and its virtues lie in the vast amount of statistical libraries that are available. Let's just say that the intersection on the Venn diagram covering statisticians and kick-ass language designers/software engineers is very small:

(the intersection is inhabited though: check the Julia language)
I picked up R while following two Coursera courses that both use R as main language: Computing for Data Analysis and Data Analysis. The former is more an introduction to programming with R, whereas the latter course focuses on applied statistics and machine learning with R. I don't have a formal background in statistics, hence Data Analysis course was much more of a challenge for me.
Setup Google Analytics with R
Enough about learning R, let's try to load some analytics data. If you want to jump right into the code and results, you can view the RMarkdown output of my exploratory analysis. RMarkdown enables literate programming, by combining Markdown syntax with R code. You can see that it shows my narrative interspersed with actual code and the output that it produces. For the remainder of this post I'll discuss some of the results from this exploratory analysis without diving too deep into the mechanics behind it.
How do you get the Google Analytics data into R? We could work with the Analytics REST API directly in R, but there is also a nice wrapper library call rga. Did I mention there's a package for everything in R? Here's how you call the Google Analytics API:
library(rga)
rga.open(instance = "ga", where = "~/temp/ga-api")
# the call above triggers the oAuth flow, and the resulting
# key is cached in the specified file.
ga.df <- ga$getData("XXXXXXXX", # replace with your GA profile id start.date = "2012-03-23", end.date = "2013-03-23", metrics = "ga:visits", dimensions = "ga:date", max = 1500, sort = "ga:date")
Yes, that instance="ga" on the second line specifies the name of a variable that will pop into existence, later to be used in ga$getData(). Life's full of dynamic surprises with R.
We're assigning the result of the ga$getData call to a variable called ga.df. Here, df is short for dataframe, a handy datatype which resembles the familiar relational table. Because R has named parameters, the actual call is more or less self-explanatory. It returns the visits by date over the specified period. All parameters with "ga:" prefixes follow the dimension and metrics name from the Google Analytics API directly.
Actually, the hardest part was finding out the right profile id to use for calling the API. Just so you know, this id is not the same as the tracking id you use on your page. Anyway, a quick way to find all your profile id's is to head to Google's OAuth2 playground, authorize the Analytics API and call:
https://www.googleapis.com/analytics/v3/management/accounts/~all/webproperties/~all/profiles
Visitors
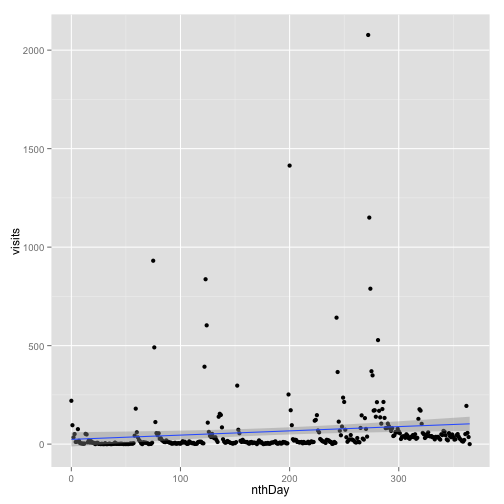
Now on to some actual numbers. In the past year, this blog received 23,903 visits (from 18724 unique visitors), generating 27,860 pageviews. As you can see, there are some huge spikes in the number of visitors:
(again, check the RMarkdown to see how the graphs are generated)
The highest datapoint was measured in December 2012 when Martin Odersky tweeted my Scala is like Git post, driving a record 2077 visits to my blog in one day. The other peaks can all be explained by referral traffic from social link sharing sites such as Reddit and DZone. Alas, 15, the median number of visits per day paints a better picture of the actual events for most days. Fortunately, the trendline (a linear regression line) is sloped upwards.
It's also interesting to see how the visits are distributed over the days of the week, using a boxplot on the same data:
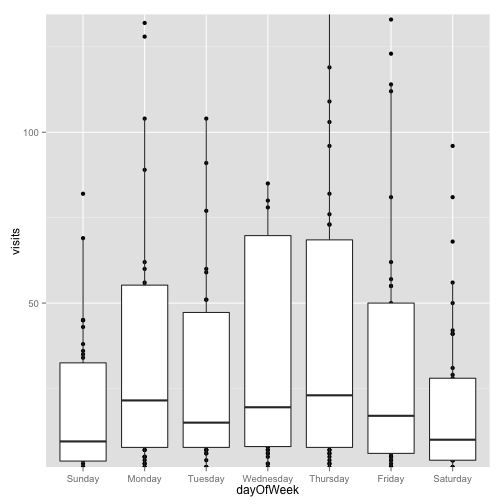
The horizontal lines inside the boxes represent the median number of visitors for that particular weekday. The boxplot is deliberately zoomed in on the y-axis to show the interesting parts. You can imagine the outlier of 2077 visits on a single day (it was on a Thursday) otherwise makes the plot unreadable. It's pretty clear that my blog is not as popular on the weekends as it is during weekdays. Apparently programming blogs are read mostly at work, which makes sense. Mondays and Thursdays are the best performing weekdays. Are people reading away their Monday blues on a programming blog? I don't have an explanation why Tuesday is relatively weak in comparison to the other weekdays.
Popular articles
Writing blog articles is a funny thing. You have complete freedom to write whatever is on your mind. Still you can't keep yourself from wondering 'who would read this?' The answer to this question is oftentimes surprising, at least to me. After a year of blogging I'm starting to find my tone of voice. I tend to write longer posts. Preferably ones that require some research and are not just short rants or opinion pieces. This approach seems to resonate with a lot of people. The following table shows exactly what was most popular on this blog last year:
| Post (pagetitle) | Pageviews | Visits | Visitors | |:-----------|------------:|-------------:|---------:| | Scala is like Git | 9383 | 8124 | 7936| | Modern concurrency and Java EE | 4300 | 3849 | 3695| |Unify client-side and server-side rendering by embedding JSON | 3141 | 2807 | 2769| | Cross-Build Injection in action | 2355 | 2111 | 2148| | Preparing a technical talk | 2343 | 2104 | 1995| | Branch and Bound Blog - Sander Mak (homepage) | 1225 | 791 | 948| | Cross-build injection attacks: how safe is your build? | 1218 | 883 | 1051| | Verify dependencies using PGP | 784 | 628 | 680| | JFall 2012: Dutch Java awesomeness | 729 | 620 | 648| | Book review: DSLs in Action | 633 | 575 | 598| | JEEConf 2012 trip report | 505 | 442 | 446| | About Sander Mak | 277 | 21 | 231| | Archive | 188 | 10 | 162| | Talks by Sander Mak | 90 | 4 | 79| | Book review: Infinity and the Mind | 70 | 50 | 55| (in some rows the visitor count exceeds the number of visits. Not sure what is up with that...)
'Scala is like Git' is the undeniable winner here, accounting for approximately a third of all pageviews in this year of blogging. I honestly did not expect this post to take off like that. On the other end of the spectrum we find 'Book review: Infinity and the Mind'. While it is also the most recent post, I don't expect it go anywhere. I still think it's a great book though, and certainly don't regret the time it has taken me to write a thorough review.
During the year, I also became part of DZone's 'Most Valuable Blogger' program. Through this program, some of the posts from above have been republished on DZone. My DZone profile shows that these republished articles garnered another 18k pageviews, which are obviously not present in my dataset.
Traffic patterns
Most of the traffic originates from social sharing sites. This becomes clear by looking at the percentage of visits by medium, over time:
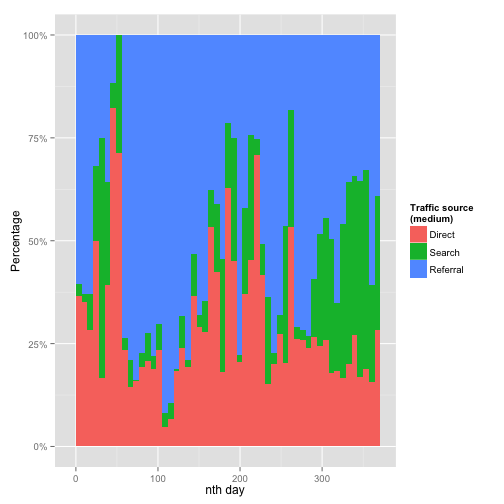
The blue area represents referral traffic. On the Google Analytics dashboard I can see that Reddit is the top referrer (29%), followed by Twitter (11%) and DZone (9%). Some posts were submitted to Hacker News as well, but unfortunately never really gained traction.
What's more interesting to me is that the percentage of "organic" traffic (ie. search traffic) is steadily increasing. That makes sense, since I started out with virtually no content and zero PageRank, but that has changed in the course of the year. In the complete analysis you can also find a graph that corroborates this finding using absolute numbers of search traffic.
Keep on blogging
It certainly was a good learning experience to free myself from the Google Analytics dashboard and try to work with the analytics data directly in R. Obviously, there's plenty more to explore. I'll get to that when my statistics and R knowledge has made sufficient progress.
While it's nice to put some numbers on what's happening with this blog, in the end it doesn't really matter. It's not a business and I'll keep writing anyway. It's fun, engaging and helps me to verbalize my thoughts whether someone reads it or not. Meanwhile, I hope this post has provided some inspiration on how to use R for analyzing and visualizing Google Analytics data.